[This notebook](https://github.com/Sage-Bionetworks/nf-hackathon-2019/blob/master/py_demos/2-drug-screening.ipynb) pulls up a table of data with the following columns:
* **internal_id.** An integer index
* **hugo_gene.** The [HUGO gene name](https://en.wikipedia.org/wiki/HUGO_Gene_Nomenclature_Committee)
* **n_quantitative.** the number of quantitative compound target associations we found for that row
* **mean_pchembl.** [Gosh.](https://www.ncbi.nlm.nih.gov/pmc/articles/PMC3965067/) "This value allows a number of roughly comparable measures of half-maximal response concentration/potency/affinity to be compared on a negative logarithmic scale (e.g. an IC50 measurement of 1 nM has a pChEMBL value of 9). The pChEMBL value is currently defined as follows: ?log10 (molar IC50, XC50, EC50, AC50, Ki, Kd or Potency)." Glad you asked? It's what we care about, but it looks like the biologist's equivalent of social science.
* **cv.** the coefficient of variance for a given compound-target relationship
* **sd.** the coefficient of variance for a given compound-target relationship
* **IC50_nM.** [The half maximal inhibitory concentration.](https://en.wikipedia.org/wiki/IC50) The notebook also gives [this link](https://www.graphpad.com/support/faq/50-of-what-how-exactly-are-ic50-and-ec50-defined/).
* **AC50_nM.** [The half maximal activation concentration.](https://www.ncbi.nlm.nih.gov/pmc/articles/PMC1797343/), the concentration which gives 50% activation of enzyme.
* **EC50_nM.** [The half maximal effective concentration.](https://en.wikipedia.org/wiki/EC50)
* **Potency_nM.** [Potency](https://en.wikipedia.org/wiki/Potency_(pharmacology)), "an imprecise term that should always be further defined"
* **Ki_nM.** [The inhibitory constant](https://www.ebmconsult.com/articles/inhibitory-constant-ki-drug-interactions), I guess
* **Kd_nM.** [The dissociation constant](https://en.wikipedia.org/wiki/Dissociation_constant)
* **n_qualitative.** the number of qualitative compound target associations we found for that row
* **std_name.** Standardized name of the chemical compound.
* **total_n.** . n_quantitative + n_qualititative
* **confidence.** a [confidence score](https://jcheminf.biomedcentral.com/articles/10.1186/s13321-018-0297-4)
* **pchembl_d.** average pchembl for that compound, across all targets
* **pchembl_t.** average pchembl for the target , across all compounds
* **known_selectivity_index.** for a given drug, the [selectivity for that target vs all of the other targets for that same drug](https://jcheminf.biomedcentral.com/articles/10.1186/s13321-018-0297-4)
We can read more about the dataset [here](https://jcheminf.biomedcentral.com/articles/10.1186/s13321-018-0297-4) and play with an interactive app to explore the data [here](https://shiny.synapse.org/users/rallaway/polypharmacology-db/) (note that the Enrichr tab doesn't work at the moment due to an issue on their end....)
The first thing the notebook does is find the gene-drug combinations with a mean PCHEMBL > 6. In so doing it introduces the [interpreted query notation](https://pandas.pydata.org/pandas-docs/stable/reference/api/pandas.DataFrame.query.html) of Pandas, which is a nice feature.
The notebook goes on to assess the effectiveness of various drug compounds on plexiform neurofibroma. We continue by pulling a drug screening dataset which has the following fields:
* **model_name.** These appear to be names of NF1 tumor cell lines available from [ATCC](https://en.wikipedia.org/wiki/ATCC_(company)).
* **model_type.** Just "cell_line". So pretty much a waste of a column.
* **cellosaurus_id.** [Cellosaurus](https://web.expasy.org/cellosaurus/) cell line database ID. Just one value, [CVCL_1959](https://web.expasy.org/cellosaurus/CVCL_1959), meaning "human", or null.
* **organism_name.** Human or mouse.
* **disease_name.** No disease, NF1 or NF2
* **disease_efo_id.** NaN, wasted column.
* **symptom_name.** No symptom, meningioma, pNF, or schwannoma.
* **symptom_efo_id.** [Experimental Factor Ontology](https://www.ebi.ac.uk/efo/), one of 693, 658 or NaN.
* **experiment_synapse_id.** Source Synapse ID.
* **study_synapse_id.** Source Synapse Project ID.
* **funder.** [CTF](https://www.ctf.org/) or [NTAP](http://www.n-tap.org/).
* **drug_name.** 2,683 drug IDs using various nomenclatures.
* **DT_explorer_internal_id.** Maps to the internal_id at synapse.org/dtexplorer - can be used to map targets and synonyms of names
* **dosage_unit.** uM, always uM.
* **drug_screen_id.** "A unique ID for each dose-response curve." There are 38,161 of these but there are 127036 rows in the table. I'm confused. I'll take a closer look at some multi-row instances in a second.
* **dosage.** A pair of floating point numbers. Of note, there are only 44 unique dosage combinations.
* **response_type.** One of AUC_Simpson or AUC_Trapezoid ([Blood glucose area under the curve](https://www.ncbi.nlm.nih.gov/pubmed/2351014), IC50_abs (the concentration of your extract required to inhibit 50% of DPPH radical), or Min_viability.
* **response.** A floating point number.
* **response_unit.** uM, % or NaN.
Returning to the matter of drug_screen_id, we can do this:
```
drug_data[["model_name", "drug_name", "drug_screen_id"]].query('model_name == @pnf').groupby(["model_name", "drug_name"]).agg(['count'])
```
Which gives us this picture:
${imageLink?synapseId=syn20726446&align=None&scale=100&responsive=true&altText=drug screen id}
If we restrict by response_type=AUC_Simpson
```
drug_data[["model_name", "drug_name", "response_type", "drug_screen_id"]].query('response_type == "AUC_Simpson"').query('model_name == @pnf').groupby(["model_name", "drug_name"]).agg(['count'])
```
Then we get 11,462 rows where drug_screen_id count is 1. So we conclude that there will be one row of drug_screen_id for each response_type in the screening.
We then restrict the dataframe to observations for AUC_Simpson and these NF1 tumor cell lines and cap the response at 100:
* ipNF05.5
* ipNF06.2A
* ipNF95.11b C/T
* ipnNF95.11C
* ipNF95.6
* ipNF05.5 (mixed clone)
* ipNF95.11b C
This is done via:
```
drug_data_pnf = (drug_data
.query('response_type == "AUC_Simpson"')
.query('model_name == @pnf')
.groupby('drug_screen_id').filter(lambda x: len(x)==1)
.assign(response = lambda x: [100 if a >= 100 else a for a in x['response']]))
```
My digression about about drug_screen_id was motivated by the fact that, in our context, this bit of code doesn't exclude any rows (they are all len(x)==1):
```
.filter(lambda x: len(x)==1)
```
I think this is just a peculiarity of using .groupby: If you don't have an aggregation function of some sort after the .groupby, then it returns an unfinished GroupBy object, not a dataframe.
This gives 11,462 rows. We then do a [box and whiskers plot](https://pandas.pydata.org/pandas-docs/stable/reference/api/pandas.DataFrame.boxplot.html) of tumor cell line name versus drug response. This gives us an idea of the range of responses available from our drugs. It looks like this:
${imageLink?synapseId=syn20726294&align=None&scale=100&responsive=true&altText=Range of drug responses}
The features of each box are as follows: "The box extends from the Q1 to Q3 quartile values of the data, with a line at the median (Q2). The whiskers extend from the edges of box to show the range of the data. The position of the whiskers is set by default to 1.5 * IQR (IQR = Q3 - Q1) from the edges of the box. Outlier points are those past the end of the whiskers"
There are a lot of dots on the top and bottom which are deemed outliers by the boxplot function. Which seems to say that our responses follow a fat-tailed distribution. We should confirm this by looking at the distributions. Let's look at the first cell line, ipNF05.5 (mixed clone). Let's start with a quick picture of the empirical distribution and then draw some conclusions:
```
drug_data_pnf.query("model_name=='ipNF05.5 (mixed clone)'").response.hist(normed=True,bins=100)
```
gives
${imageLink?synapseId=syn20726447&align=None&scale=150&responsive=true&altText=cell line fat tail distribution}
We're looking at a positive skewed distribution. We can use the [magic of Python](https://pythonhosted.org/fitter/) to pick the best fitting one. Note that this is a merge of responses to a lot of different compounds. It is telling us, I suppose, that the drugs to which the cell line responds at the long end of the curve are really hitting the mark:
```
from fitter import Fitter
f = Fitter(data)
f.fit()
f.summary()
```
We discover that the response fits a [Student's T distribution](https://docs.scipy.org/doc/scipy/reference/generated/scipy.stats.t.html) with 2.13 degrees of freedom, mean 50.25 and variance 5.54:
${imageLink?synapseId=syn20727389&align=None&scale=100&responsive=true&altText=}
Next, the notebook filters by [Synapse Drug-Target Explorer ID](https://www.synapse.org/#!Synapse:syn11672851/wiki/513661), where for the given ID there are 4 or more records, and then gets the median response within that ID. For example, DTID 313943 cell line ipNF05.5 (mixed clone) has a median response of 48.484761.
**Note:** I looked at the [Drug-Target Explorer](https://shiny.synapse.org/users/rallaway/polypharmacology-db/), and at first glance, I could not figure out how to explore based on the DTID of 313943 or the cell line of "ipNF05.5 (mixed clone)".
Then we "plot a heatmap of the AUCs of all of the MTOR and KIF11 inhibitors", where MTOR and KIF11 are genes. Measurement is based on response. I'm not sure how a response is qualified as an inhibitor versus, say, an excitor. We get a heatmap where the X axis is cell lines and the Y axis is drugs. It looks like this:
${imageLink?synapseId=syn20727502&align=None&scale=100&responsive=true&altText=}
The notebook observes that there is various action on the cell lines, too much to eyeball.
**Note:** The code is filtering on genes associated with the cell line. I don't know how the response is being associated to individual genes. Presumably a cell line is produced by the action of basically an unknown number of genes. I want to know: For an experiment (DTID), is the effect averaged over all genes associated with the cell line, or what?
```
gene_pchembl=targets.dropna(subset=['mean_pchembl']).query('std_name=="CHEMBL204871"').filter(["hugo_gene", "mean_pchembl"]))
```
Before I show you the result, let's also figure out how to [store a table result in Synapse from Python directly](https://python-docs.synapse.org/build/html/Table.html), as opposed to say uploading a CSV file. This is pretty easy:
```
from synapseclient.table import build_table
project = syn.get('syn20710313')
table = build_table('CHEMBL204871 gene PChEMBL', project, gene_pchembl)
syn.store(table)
```
So based on what we can see (generalizing on a sample size of 1),
${synapsetable?query=select %2A from syn20727509&showquery=true}
it seems to be the case that mean_pchembl is allocated equally to all genes associated with a cell line. It is still not obvious how genes are associated to a single cell, since presumably each cell contains all genes in the DNA of the subject.
We then go on to explore some clustering techniques. The notebook then creates a matrix where the rows are DTID and the columns are gene names and the cell values I don't quite understand. There is a "foo" in there and a "1" in cell 0,0. This is called the "binarized target matrix". Basically it's just putting a checkmark against each gene mentioned for a DTID where the DTID is presumably against a single cell line but for multiple drugs.
Out of curiousity, we can look at how often each gene is cited in any DTID, and pick the top usages:
```
gene_usage=pd.DataFrame(list(target_data_filt.sum().to_dict().items()), columns=['hugo_gene', 'dtid_occurence']).sort_values('dtid_occurence',ascending=False)
```
giving
${synapsetable?query=select %2A from syn20727510 where "hugo%5Fgene"%3D%27MTOR%27 or dtid%5Foccurence > 53&showquery=true}
Note that it took me about 15 tries to get the query right to include MTOR. Here are the derived rules about the query syntax, which is not Python and not SQL:
* Column names are enclosed in double quotes "
* String values are enclosed in single quotes '
* Equality is denoted with = not ==
So we have this binary matrix of DTID x gene name and we do a [Uniform Manifold Approximation and Projection for Dimension Reduction](https://umap-learn.readthedocs.io/en/latest/). "The embedding is found by searching for a low dimensional projection of the data that has the closest possible equivalent fuzzy topological structure." Mmm hmmm. That turns our 1142x1605 binary matrix into this picture, which I don't know how to read:
${imageLink?synapseId=syn20727519&align=None&scale=100&responsive=true&altText=}
The notebook then adds labels to this plot. It makes a dataframe of the umap plot points. It identifies each drug with a DTID (so I guess DTIDs are each associated with a single drug). Each point in the UMAP corresponds to a row in the original filtered set, so it then glues on the DTID to each umap point. The act of assigning columns to the umap points, which are an [Int64Index](https://pandas.pydata.org/pandas-docs/version/0.23.4/generated/pandas.Int64Index.html) (whatever that is) turn it into a DataFrame (pandas is the new R, where objects change type all the time). We then extra a map of DTIDs to drug names from the original target list. We make a map of median response to DTID. Then we mash that all together to get a frame with x, y, DTID, median response and drug name. Finally, this gets plotted where the dots have color intensity corresponding to response. We make a short list of names where the response is < 30, which I guess means it's an inhibitor, but I have no clue. I would have guessed the filter would go the other way, but I don't know any biology. Finally, we plot this picture:
${imageLink?synapseId=syn20727520&align=None&scale=100&responsive=true&altText=}
So let me repeat at this point that I don't have any intuition for this space and I don't know why we like drugs with a low response number or what it means for the drugs to be positioned at one point or another in this cloud of dots. It seems like we would [want a high AUC](https://sepia.unil.ch/pharmacology/index.php?id=66), not a low one. My Googling on this topic has not borne fruit.
The next thing the notebook tries is clustering. We're going with 6 nearest neighbors and 3 components (the ability to do more than 2 components is an improvement over the PCA technique of the first notebook). We are clustering the binary association matrix again. This the space of genes into 3 proto-genes and each drug gets assigned a point in 3-gene space. We get something called "labels" from something called "HDBSCAN". Y'all can [read this](https://hdbscan.readthedocs.io/en/latest/how_hdbscan_works.html). Apparently it's self-explanatory. From that we get a [dendrogram](https://en.wikipedia.org/wiki/Dendrogram) which, mmm ok.
${imageLink?synapseId=syn20727521&align=None&scale=100&responsive=true&altText=}
We then color our UMAP cluster points from the clusters in the HDBSCAN, which turns out to be promising, althrough I don't get the color scheme: We asked for 3 clusters, but I see many more colors. In fact I am seeing 93 colors,
```
df.labels.unique().shape
```
which is a lot more than 3 clusters. I guess this corresponds to the leaves of the dendrogram. Help, I am losing intuition again!
${imageLink?synapseId=syn20727522&align=None&scale=100&responsive=true&altText=}
From this picture we pick out some sets of drugs with AUC < 40 that are clustered in neighboring proto-gene space. Still seems like a reach. Anyway, we get something which might be a good filter. I'm stuck on the AUC issue, I don't know why low AUC is good, but I'll take it for granted. Also I don't know how you go from proto-gene clustering, which is based on compression of arbitrary labels on columns in a matrix, to actual relatedness between real genes, signal receptors and drug chemical compounds fitting those receptors. There's a leap of faith there between the "data science" and the underlying biology that I could use some help explaining. I'm assuming that we're seeing this search technique because it works, but it would be helpful if someone could fill in the blanks.
${imageLink?synapseId=syn20727525&align=None&scale=100&responsive=true&altText=}
Created by Lars Ericson lars.ericson So the options are to
* Deliver cloned NF1+/+ or NF1+/+ mimetic into the tumor site
* Stimulate NF1+ production in case NF1+/- is naturally available in the tumor site
* Attack the cell growth signalling network at various stages
Can you expand on "Selumetinib targets a downstream protein in the NF1-RAS pathway, MEK. NF1 loss causes Ras hyperactivation, and RAS hyperactivates the MEK-ERK pathway." In particular can we post an NF1-RAS pathway map that everyone agrees on, with sub-pathway MEK-ERK? Is this something you can make a complete picture of? Does it then have, for each node in the graph, known receptor sites that we can search for drugs for, for one of the following types of interactions?
* inhibitors
* activators
* cofactors
* ligands
* vaccines Hi Lars,
Therein lies the rub. NF1 is caused by a loss of function mutation, so even if an inhibitor of the NF1 protein was discovered, it wouldn't help. In most cases I have seen mutated NF1 protein expression is low or non existent. If there are some edge cases in which NF1 protein is still present in NF1 tumors, you'd want something like an allosteric activator, but these are not easy to identify or predict, and not common in the landscape of drugs, so I'm not sure there's a good roadmap for identifying them. And even then, the activator would likely have different effects in different NF1 mutations, since the mutations also alter the structure of NF1.
A more fruitful path if you are trying to *directly target* the loss of NF1 is probably some sort of gene therapy using the NF1 RAS-GRD or similar, but gene therapy is a huge challenge with lots of pitfalls and many years of research. Some challenges there include getting the NF1 construct into all of the cells it needs to get into, expressing the NF1 RAS-GRD in cells in a modulatable fashion, and overcoming things like proteasomal/autophagosomal degradation of the protein, etc. I think these are challenges that have plagued gene therapy for decades (among other challenges)...but that's not my realm of expertise.
Selumetinib targets a downstream protein in the NF1-RAS pathway, MEK. NF1 loss causes Ras hyperactivation, and RAS hyperactivates the MEK-ERK pathway. So that is a reasonable target in this case.
AUC is just a measure of the area under the dose-response curve. In the case of more potent drugs, lower doses cause lower viability, so AUC decreases.
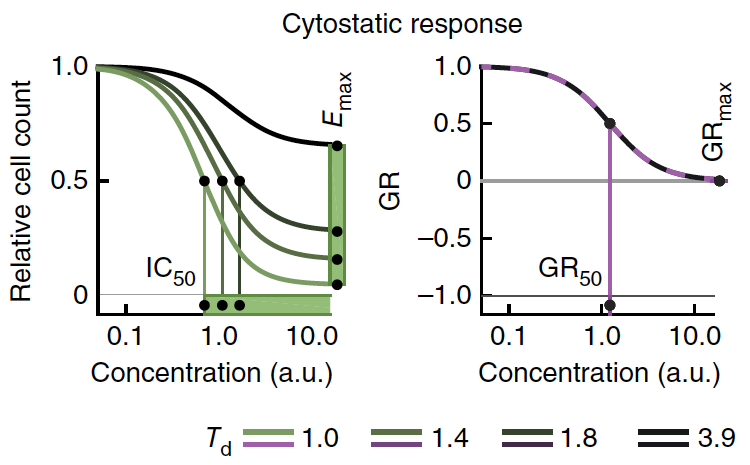
In this image, the more potent drug (green) has a lower area under the curve than the darker curves.
Some people measure drug response in terms of % response, instead of % viability, so more potent drugs have _larger_ areas under the curve. In this case we are looking only at % viability data. Hi Robert,
Do we have the tools and data to identify small molecules that bind or inhibit NF1 this weekend? Can you describe a successful process of locating a binder/inhibitor for another gene that is in the database? I.e.
* What data went into the process
* The sequence of modelling or search techniques that were used
* Any physical lab procedures that were required to confirm or assist in the identification
Looking at such a realized case would tell us what we can accomplish over the weekend and give us a protocol for search.
Also, where does [selumitinib](https://www.astrazeneca.com/media-centre/press-releases/2019/selumetinib-granted-us-breakthrough-therapy-designation-in-neurofibromatosis-type-1-01042019.html) fit in this process? Does it not bind or inhibit NF1? Is it a large molecule rather than a small one? If it is a large molecule, what is different about the search process for large molecules versus small ones? Is there a large molecule database?
Also can you explain why low AUC indicates a more active drug than high AUC? I was confused on that part in one of the notebooks. Also, how is the IMPACT column LOW/MEDIUM/HIGH score derived for whole genome/exome data?
Thanks,
Lars Hi Lars,
The database captures all known (publicly available) compound target information from databases like DrugBank, ChEMBL, and a couple of others. These are all compounds that bind or inhibit targets. Unfortunately, there are no known small molecules that bind or inhibit NF1, so that's why there is nothing there.
Hi Robert,
I looked at the DT Explorer: https://shiny.synapse.org/users/rallaway/polypharmacology-db/
If you go to the "Gene" tab and type in NF1, it gives you two options HNF1A and SERPINF1 but no NF1.
Can we get it populated for NF1? Or does it have to be drugs already established for NF1? Or anything that might fit an NF1-related receptor?
Thanks,
Lars Hi Lars, that fixed the images. thanks!
For syn20716008, you should be able to go to File Tools --> File Sharing Settings, where there should be a small button that says "Make Private." Hi Robert,
I set the fields in the Team Shirin project to "Synapse Users Can Download". If you are still having a problem, I sent you an invite for that team. You can accept the invite and fix the permissions. Actually the files are here: https://www.synapse.org/#!Synapse:syn20710313/files/
I also set the files to be world readable but I still get login request to view file-based resources if I try to look at the page without logging in.
I also need to set one file, syn20716008, to Private to the Team Shirin project. I'm not sure how to do that.
Thanks,
Lars n_quantitative. the number of quantitative compound target associations we found for that row
cv. the coefficient of variance for a given compound-target relationship
sd the coefficient of variance for a given compound-target relationship
n_qualitative. the number of qualitative compound target associations we found for that row
total_n. n_quantitative + n_qualititative
confidence. a confidence score - you can see the formula here: https://jcheminf.biomedcentral.com/articles/10.1186/s13321-018-0297-4
pchembl_d. average pchembl for that compound, across all targets
pchembl_t. average pchembl for the target , across all compounds
also, the known_selectivity_index, for a given drug, the selectivity for that target vs all of the other targets for that same drug. it is also a formula described here: https://jcheminf.biomedcentral.com/articles/10.1186/s13321-018-0297-4
you can read more about the dataset here : https://jcheminf.biomedcentral.com/articles/10.1186/s13321-018-0297-4 and play with an interactive app to explore the data here: https://shiny.synapse.org/users/rallaway/polypharmacology-db/ (note that the Enrichr tab doesn't work at the moment due to an issue on their end....) Hi Lars, the images you are sharing are not accessible to others - This is what this post looks like to me:
https://imgur.com/a/adKk8Hk
If you set the project you are hosting these images in to "Synapse Users Can Download" under the Project Settings -> Project Sharing Settings menu (top right of project page), I think that will fix this issue. ]
Drop files to upload
Digesting the 2-drug-screening notebook page is loading…